A 2012 study finds that 3 statistics are the attacking variables associated the most with winning.
Castellano, Casamichana and Carlos Lago showed that ball possession, the total number of shots, and the total number of shots on target were the most crucial attacking statistics associated with higher odds of winning.
So I scraped data from the match data website Flashscore.com, kept the data from the latest qualification rounds and produced a profile of all clubs for which data was available.
The data comes from qualification matches, therefore you need to know that all those stats are from matches disputed within regional associations, like CONCACAF for Central & South America clubs and UEFA for European ones.
So the data is about the football clubs’ performance against other clubs from the same region only.
Visualisations below. You might want to click on them to have a better view.
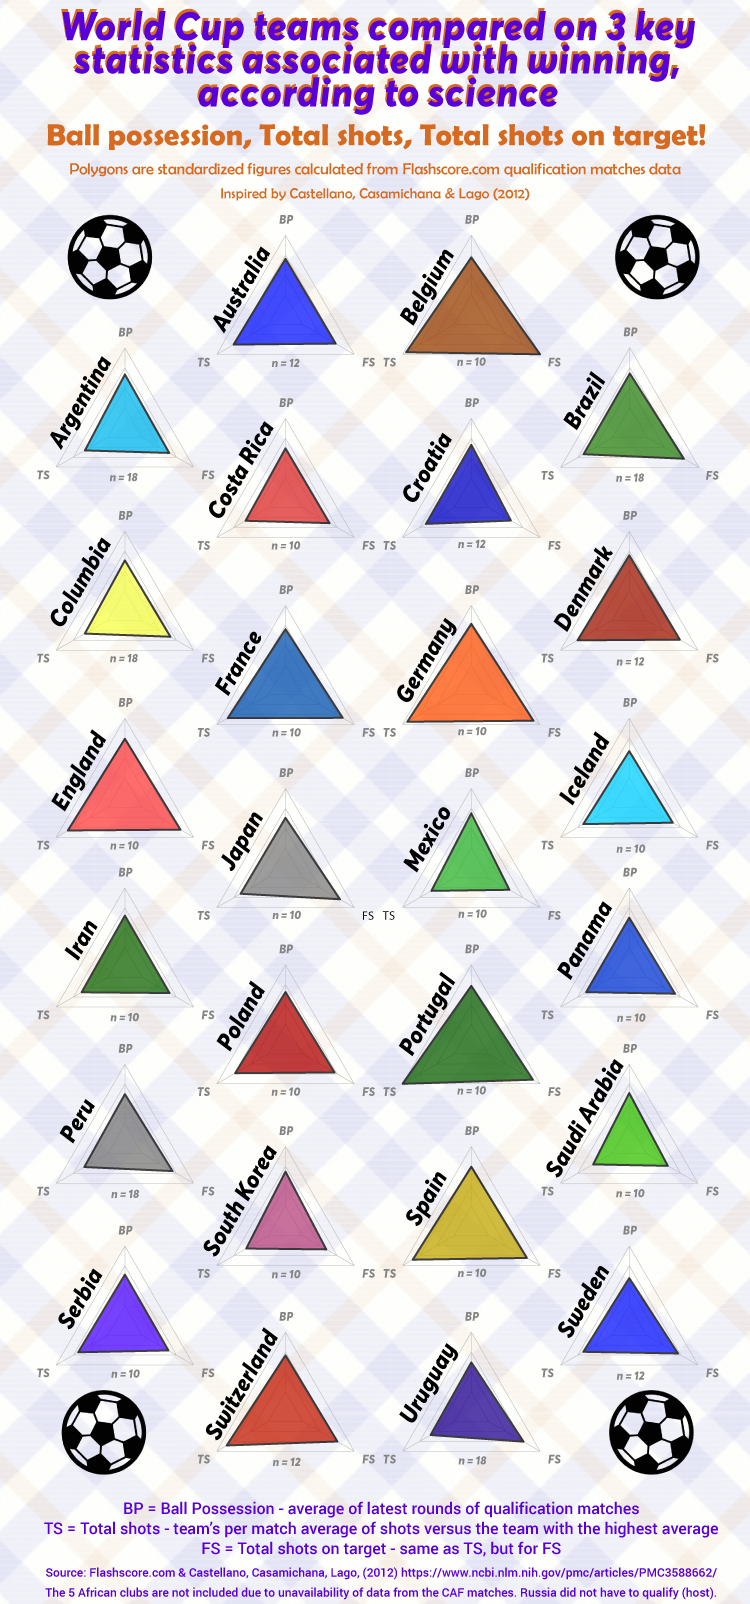
Here are the clubs compared on those 3 average statistics. The bigger the triangle, the better the team played during qualification matches.
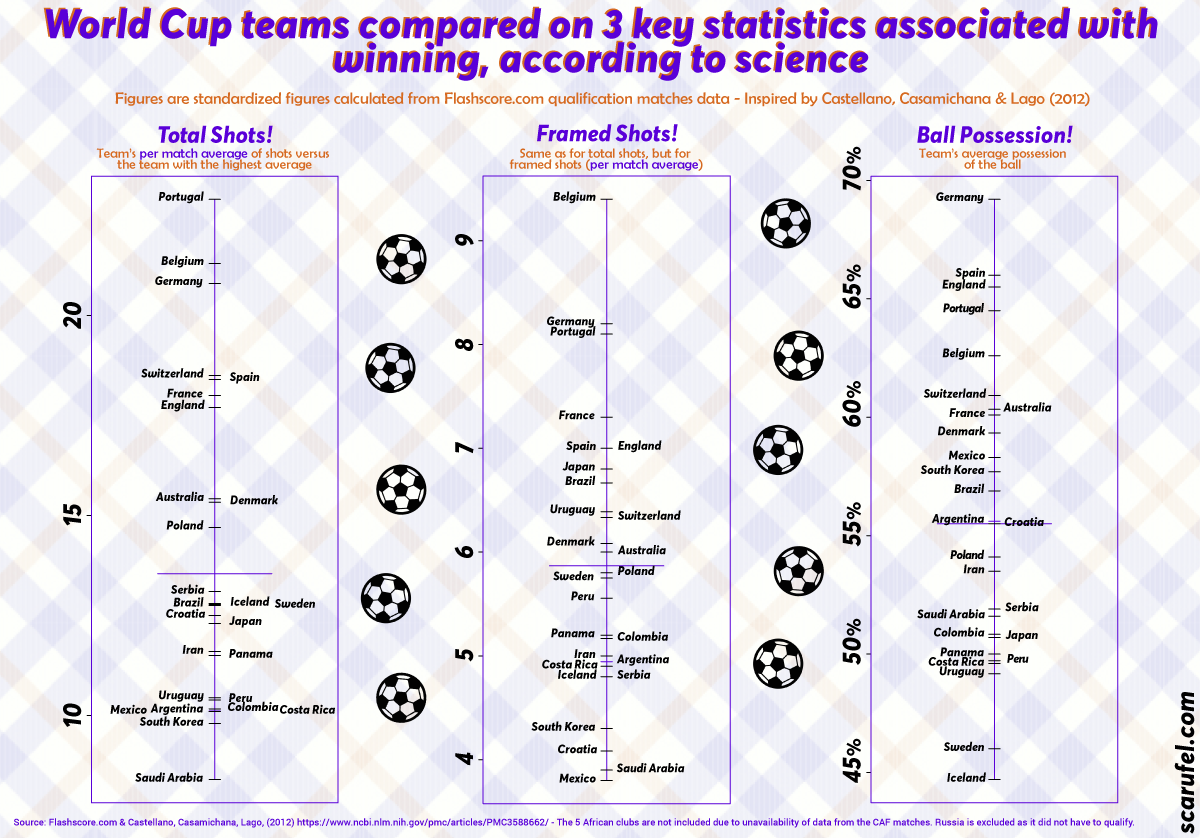
And here are the clubs compared on those 3 average statistics, with a better focus on the 3 key statistics. The higher the country, the better the team played during qualification matches.
All the data was calculated to represent the clubs’ average per match.
For the total shots and total shots on target, figures were standardized. The reference is the highest score obtained by a team, and from which a percentage was calculated for other teams.
For instance, if the most successful team had an average or 15 shots per game and another one had 9, the first team would get its full corner in its triangle for this metric, while the second team would get 60% (9 / 15). The goal (pun intended) was to put everything in percentage for the triangle.
Unfortunately, data for the African clubs was unavailable. As hosts, Russia did not have to qualify.
The data was scraped using Webscraper, the Chrome extension. It was then cleaned in Excel then R, processed and visualized in R and finalized with Illustrator.


